

To be more specific, I will be discussing analyzing code with SonarQube in a fully containerized setup.
SonarQube is an open-source code analysis tool that I have been using on-and-off for a while. Until now, I have been using an installation provided to me by some sort of QA team and I have not been involved in the setting up or maintaining of the SonarQube installation or its integrations. However, in these cases getting the code analyzed has often required pushing it to the version control and waiting for feedback from analysis triggered by a CI run. This means it might take a while before the code analysis is available.
In order to reduce the time between making a code change and getting the SonarQube analysis results, I took the time to look into how to get started with a local SonarQube installation. In this post, I share my process of running SonarQube in a container, analyzing code with sonar-scanner-cli docker image, as well as integrating this local SonarQube instance to a local Jenkins instance and pipelines running there.
Getting started with SonarQube
To get started with SonarQube, we need to have access to a SonarQube instance, obviously. To launch SonarQube locally, we create a docker-compose.yml file with the following content. We can use the sonarqube Docker image with a persistent volume and port binding for a simple development setup. See also examples in the SonarSource/docker-sonarqube repository for reference. Launch the setup with docker-compose up.
version: "3"
services:
sonarqube:
image: sonarqube:community
ports:
# Web user interface
- 9000:9000
volumes:
- "sonarqube.data:/opt/sonarqube/"
volumes:
sonarqube.data:
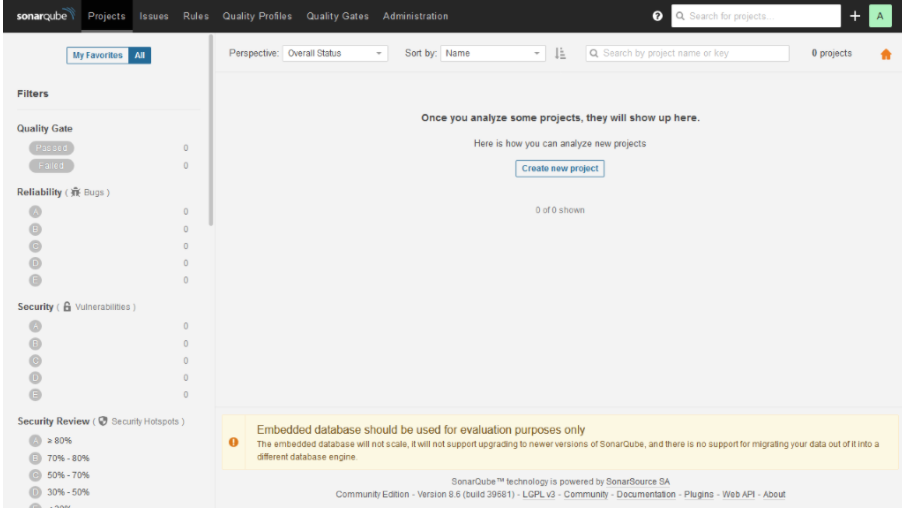
After starting the sonarqube container, you should be able to see the SonarQube user interface in http://localhost:9000. Especially on the first launch, it might take quite long before the user interface is up and running. The default credentials to the SonarQube are admin:admin. Use these for the initial login. After the login, you should see a view similar to the screenshot below.
 Finally, before getting to the actual code analysis, we need to create an access token that we can use to authenticate to the SonarQube from our environment. This can be done from the security tab of the My account menu, which can be opened by clicking the profile picture in the upper right corner. Create a token and store its value for future use. Note that you can only access the token value right after the creation.
Analyzing code with sonar-scanner
In order to analyze some code and to test the SonarQube installation, run sonar-scanner in a code repository. This can be done, for example, by using the sonarsource/sonar-scanner-cli Docker image, with the following command. The analysis can be done for pretty much any repository which has code in language supported by SonarQube. For basic analysis, there is no need for a sonar-project.properties configuration file, which could be used to tune the analysis.
docker run \
--rm \
--net host \
-e SONAR_HOST_URL="http://localhost:9000" \
-v ${PWD}:/usr/src \
sonarsource/sonar-scanner-cli \
-D"sonar.projectKey=$(basename ${PWD})" \
-D"sonar.login=${your_sonar_access_token}"
Here we run the sonar-scanner in a Docker container with host networking to be able to use localhost in the SonarQube URL, which is set via SONAR_HOST_URL environment variable. We also mount the current working directory to the container and set projectKey and login properties. Note that you will have to replace ${your_sonar_access_token} with the token, you created in the previous step.
After the sonar-scanner run has finished, there should be a list of analysis projects visible in the default view of the SonarQube. See the screenshot below, for an example. While SonarQube produces a wide range of feedback with its default setting, some of the features such as test coverage analysis would require project specific configuration through a sonar-project.properties configuration file.
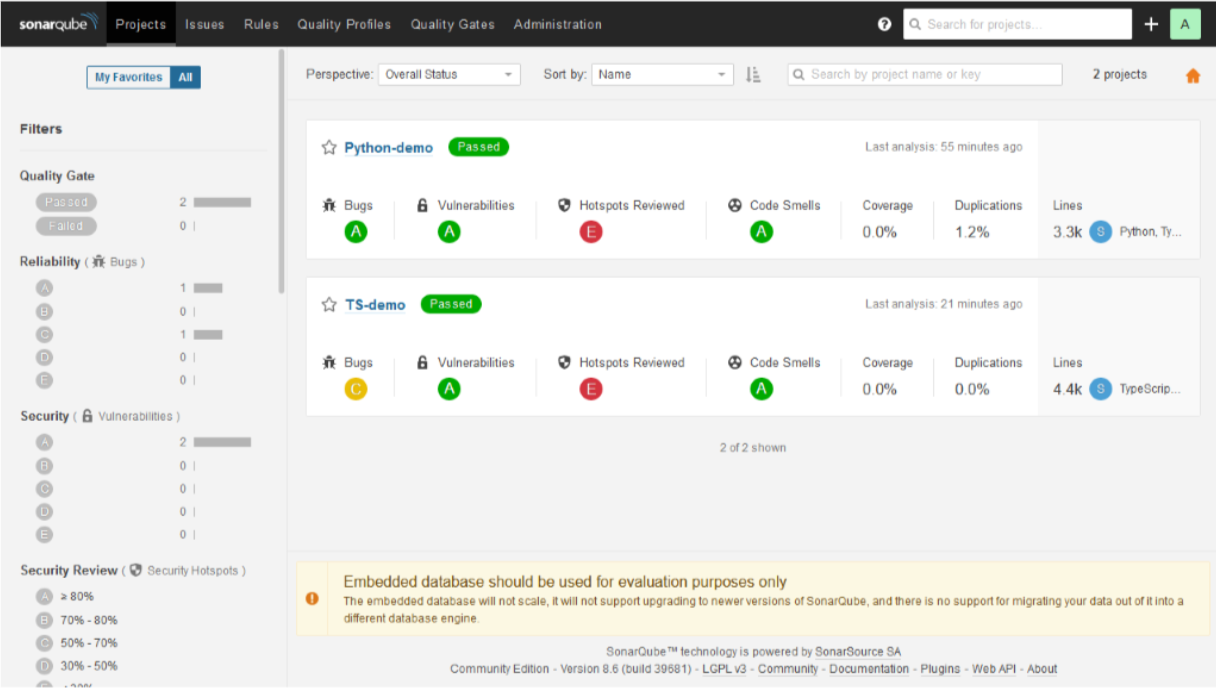
The types of feedback generated by the SonarQube range from detecting code smells such-as commented-out code or new TODO comments to highlighting possible security problems such as missing CSRF prevention or usage of a pseudo random number generator. In my experience, SonarQube produces more and better quality analysis output, already with its default settings, than simpler static analysis tools such as pylint and eslint.
This increased analysis quality comes at a cost of slower analysis times and more complicated analysis environment. The language specific static analysis tools, such as pylint or eslint, are easily run as a part of the CI pipeline together with the unit-tests and the analysis takes seconds. On the other hand, SonarQube analysis requires a SonarQube server for the analysis to be possible and the analysis run with the sonar-scanner might take minutes instead of seconds.
In addition to being slower than simpler code analysis tools, SonarQube is much more resource intensive. This will not likely be an issue when SonarQube is hosted in its designated environment, such as CI server. However, running SonarQube in the development environment might require scaling up the development server. For example, I had to increase the size of my Docker for Windows virtual machine to 2 vCPUs, 3 GB of memory, 24 GB disk in order to avoid analyses failing due to lack of resources.
Integrating SonarQube to a Jenkins pipeline
In order to integrate SonarQube to Jenkins pipeline, we need a Jenkins instance. If you do not have a Jenkins instance already available, see my previous Jenkins related post for instructions on how to setup a local development instance with Docker. If you are using existing Jenkins, ensure that the Jenkins can run on-demand Docker containers and that you can install plugins. In addition, your Jenkins instance should be bound to a host port. This guide assumes Jenkins to be available in http://localhost:8080.
Before setting up the SonarQube connection in Jenkins, we need to know the local IP address of the host machine you are working on. On linux systems, you can find your local IP with hostname -I command. On Windows systems, you can find your local by looking for an IP address from the output of ipconfig command.
For configuring the SonarQube connection, first, install SonarQube Scanner plugin to your Jenkins instance through Manage Jenkins > Manage plugins menu. Configure SonarQube instance to SonarQube servers section of the Manage Jenkins > Configure System menu: Use http://${HOST_IP}:9000, where ${HOST_IP} is the IP address of the host machine, as the server URL and create a secret text credential for the access token you stored earlier.
After the SonarQube server is configured to Jenkins, sonar-scanner can be executed in a stage that uses the same sonarsource/sonar-scanner-cli Docker image that was used in the previous step as well. This can be done with a stage level Docker agent:
stage('Analyze') {
agent {
docker {
image 'sonarsource/sonar-scanner-cli'
// To guarantee that the workspace contains the sources pulled in previous
// stage, we need to use the pipeline level workspace.
reuseNode true
}
}
steps {
// The parameter must match the name you gave for the SonarQube server when
// configuring it.
withSonarQubeEnv('Sonar') {
// Here, job name is used as the project key and current workspace as the
// sources location.
sh """
sonar-scanner \
-D'sonar.projectKey=${JOB_NAME}'\
-D'sonar.sources=${WORKSPACE}'
"""
}
}
}
The example above assumes that you have checked out the code to be analyzed to the project workspace in an earlier stage. The example analyzes the code available in the project workspace and uses the Jenkins project name as the project key in SonarQube.
After the pipeline with sonar-scanner run has been executed, the project view in Jenkins should include the SonarQube quality gate status of the linked Sonar Project. These SonarQube quality gate status indicators also function as links to the connected SonarQube project. The SonarQube project is also accessible through the project list of the SonarQube instance.
Summary
To conclude, this post described the process of setting up a local SonarQube code analysis environment with docker compose. We run a code analysis to this local environment with sonar-scanner running in a different container with a mount access to our code. Finally, we integrated the SonarQube analysis to be a part of a Jenkins pipeline. The code snippets from this blog post are also available in kangasta/jenkins-examples.
Note that this setup should only be used for development. For anything production like, configure SonarQube to use database such as postgres, do not use root or admin credentials, and setup Jenkins and SonarQube to a suitable private network. See also Jenkins and SonarQube documentation for production usage instructions.

About trainings and courses at Knowit: During the Covid 19 pandemic we are holding all courses online. Please contact Kari Kakkonen for more information on courses and practicalities: kari.kakkonen@knowit.fi and +358 40 523 9004